Archives → Lesson Idea
Dates as Operations 2018
In 2017 I published a post Dates as operations 2017 - a collaborative effort to write a mathematical statement from the digits of the date.
Here is the 2018 version. To quickly access in class type gomaths.net/dates into your address bar.
Updated for 2019: gomaths.net/dates
Updated for 2021: gomaths.net/dates
Updated for 2022: gomaths.net/dates
Updated for 2023: gomaths.net/dates
Dates as Operations 2017
Like most teachers I write the date at the top of the whiteboard each day. As an extra point of interest, in 2016 I endeavoured to write a number sentence using the digits of the date, in order, underneath the date.
Data values vs scores
Note for self really,
In the new NSW Syllabus for Mathematics K-10 what used to be referred to as scores when analysing data are now called data values.
So the definition of mean is written as
$$\bar{x}=\frac{\text{sum of data values}}{\text{number of data values}}$$
Bingo: Fractions, decimals and percentages
I've added an additional game under the Fractions category on MathsStarters Bingo:
Animated perimeter and area
For a recent session with teachers about whole school numeracy, I created a couple of animations demonstrating:
Odometer, the Universe and trains
Today in class, Year 7, I linked to decimals:
- the odometer in my car... rounding 19.999 to 2 decimals places is like 19999 on the odometer kicking over to 20000
- π...
and the universe - trains terminating at the end of the line
- Luna Park, because trains terminate behind Luna Park
- and of course, Arnie, the Terminator.
Pythagorean Dates
 Monday (17/08/15) was a Pythagorean Day (172 = 82 + 152).
Magic Vs - Year 5 Lesson
 Today I had the fun of 20 Year 5 students in my classroom. I used the Magic Vs problem from NRICH. NRICH have lots of good leading questions, solution discussions and videos. There was lots of great thinking and discussion.
I made a SMART Notebook file to aid the discussions, available on MathsFaculty.
Bingo: Trig Exact Values (Radians)
I've had Make bingo for trig exact with radians on my To Do list for a while.
Percentages Foldable
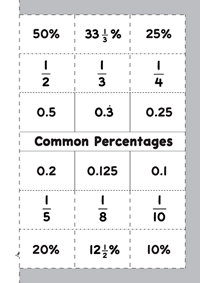 I recently made a Percentages Foldable (common percentages and their fraction and decimal equivalences) to include in our school newsletter. The idea was to encourage students (or parents) to make the foldable and put it on the fridge, or somewhere else prominent, to encourage the remembering of some common percentage comversions.
Relative Frequency - Investigation
Probability is one of those topics where it's best to "see it".
Rounding Using Significant Figures - MathsFaculty
A resource I put together for practising rounding using significant figures.
Self-checking Christmas Worksheet
Here's a self-checking, simple questions, as you get the answers correct the tree lights up.
Nothing fancy. Just needed something for a computer lab tomorrow.
Sierpinski Triangle
Continuing with some design and construction activities for the end of term.
Pizza, it must be engaging, right?
Recently, I have been considering how to see more fruit in my classroom. As I mentioned previously, the effort factor is significant. The modern idea that students will (or should?) only engage in activities of interest to them goes against everything they will come up against in the future.
Constructing Triangles
One of the challenges I had this week when students were constructing rectangles and squares using a ruler and set square (drafting triangle) was checking the accuracy of the measurements (sides and angles). I walked around with a ruler and set square checking their drawings.
Scale Cars
Matchbox cars, specifically that brand, have a scale written underneath.
I've always wanted to do something with that.
End of Term 9 - world’s best paper airplane
I think I just found the activity for the last period on the last day of the year.
Video of myself in lessons
Looking at the area of special quadrilaterals, I wanted the class to make the quadrilaterals starting with paper rectangles.
This particularly class, however, struggle with step-by-step instructions. A document camera would be great, but I don't have one.
So I made a set of videos, these had the benefit of being large, on the big screen and something a little different.
I need to do this better #1 of ∞: find missing side
Students struggle with this:
Problem Solving, Spider and the Fly
How would use this in your classroom (the problem, not the video)?
The Developing Teacher
In the past, Maths teaching resources amounted to printed materials (be it a textbook, BLM). If the teacher didn't like what was available to them, they could hand-draw and Gestetner a more appropriate worksheet.
Preparing to Engage, Enhance and Extend
I am presenting twice in September about how I use technology to engage, enhance and extend in my teaching.
Simple Harmonic Motion with Sam
Back in 2012 when I first taught Extension 1 Mathematics, in particular Applications of Calculus to the Physical World - Simple Harmonic Motion (SHM), I captured this clip of my then 2 year old son:
Water usage and collection
For my HSC Mathematics General 1 class, we are currently completing the Focus Study FSPe1CEC Water usage and collection.
In this topic, students interpret information, make comparisons, and perform a range of calculations in relation to personal water usage.
Solving Equations Booklet
These are resources I developed for a Year 9 5.1* class.
(What is not shown in these resources is not all of the conceptual steps I took with this class.)
MathsLinks This Week 11 May 2014
I want to start writing more regularly to highlight some of the resources on MathsLinks and MathsFaculty, and putting them in the context of my teaching.
Activity - Atlantis and Hubble in front of the Sun
If we can determine the altitude of a plane in front of the moon, why not try the altitude of the Space Shuttle Atlantis in front of the Sun?
Activity- Airplane in front of the moon
Back in 2011, Nordin Zuber posted this found image on MathsLinks.
Number of the day
Here's a starter activity I have built on MathsStarters: Number of the day.
MANSW 2013 Day 1
A summary of the sessions I attended at the 2013 MANSW Annual Conference. This summary is the key points I wanted to remember.
Classifying Data - Foldable
Here’s a second foldable for the Preliminary (Year 11) General Mathematics course for the topic DS1 Statistics and society, data collection and sampling.
This second foldable is about classifying data.
Statistical Inquiry Foldable
I’m trying to make the time to create foldables to use with my Year 11 General Mathematics class. The topic DS1 Statistics and society, data collection and sampling lends itself to foldables.
The first foldable is for the process of statistical inquiry:
posing questions, collecting data, organising data, summarising and displaying data, analysing data and drawing conclusions, and writing a report
Number Sense Posters
For a few years, I’ve noticed that kids not only don’t know/struggle with their times tables, but also general ‘number sense’.
Animated Budgie
Mathematical Induction, topic 7.4 in the NSW Board of Studies Mathematics Extension 1 Syllabus, is difficult conceptual. I suspect students think there is a bit of smoke and mirrors happening. One introduction that I use, I first saw in a resource by Stuart Palmer. The same story appears in this article online: Mathematical Induction (PDF 92KB), Helen Bush, Reflections August 1992 sourced on NSW HSC Online.
Series Foldable
For “Arts and Crafts Thursday”* we made a foldable to summarise the formula in the topic Series and Applications (Topic 7 in the NSW BOS Mathematics Syllabus).
Kitchen Scale
I put up my first image on Dan Meyer’s 101 Questions yesterday, Kitchen Scale. Wander over there.
What’s the first question that comes to your mind?
It does the Math™
Back in 2010, putting a piece of wall in our kitchen to attach a child gate to, a problem arose about evenly spacing screws.
Consumer Arithmetic - Spending - Electronic Worksheets
This is part 2 of my electronic worksheets for Consumer Arithmetic. Part 2 focuses on Spending Money, in particular: profit and loss, discounts, purchasing, best buys and buying on terms (hire purchase). (Part 1 focused on earning money)
MathsClass This Week 2 December 2012
 Nearing the end of the year, I’ve updated a previous MathsClass blog post from 2008 with additional supporting material to make this nice design. Files available on MathsFaculty.
There are other end of term activities on MathsClass and design activities on MathsFaculty.
Consumer Arithmetic - Electronic Worksheets
Through the start of this term, I’ve been creating a series of electronic worksheets (in Excel) to cover the ‘earning money’ part of a Consumer Arithmetic topic.
Times Tables Grid Wall Poster (Made4Math)
It’s the last day of term here, so teachers might want to spend some time today fixing up their room. So, I brought my Made4Math Monday forward.
I needed some times table posters for my classroom, but the posters you can buy tend to be for younger students and I haven’t seen a grid version (rather than each table listed separately).
Being too helpful?
As I said in an earlier post...
2012 is looking like a year of quiet reflection (i.e. maybe not much on this blog), contemplation and trial and error.
Here is some recent thinking, please comment.
Rules for Differentiation - Foldable (Math4Math)
A foldable for reviewing the Rules of Differentiation. Click the preview to see the full version.
Functions and Quadratics Foldables (Made4Math #1)
Year 11 Mathematics have one of their three periods a week, last period on Fridays. Of course, they’re not highly motivated at that time.
The other week, we folded parabolas, I called it “Arts and Craft Friday”.
The next week, they surprised me by asking what we were doing for “Arts and Craft Friday”... I had nothing!
Code Breaking
I recently received an email from the AAMT:
National Mathematics Day is Friday 18 May and looks at codes and code-breaking — to celebrate the centenary of the birth of Alan Turing.
The Biggest Loser 2012
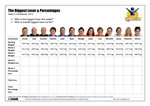
Each year I use the TV Show, The Biggest Loser, as an application of percentages – here is a worksheet for 2012 setting out the contestant data that your students can use to perform some calculations.
I’m completing this activity earlier than normal this year, so the data is from earlier in the competition.
Locker Problem
I recently used the “Locker Problem” in a Year 7 Maths Enrichment class (mixed ability). Here are some resources I used:
Lesson Prep
Where do you go for maths lessons and good lesson ideas?
Here’s the start of my list, I’m not particularly recommending these sites, just listing them as places to look for ideas.
Lift Buttons
Whilst often used as a textbook example, I had never seen negative numbers used in a lift before.
Superman Number Plane Logo
A number plane drawing worksheet for making the Superman logo. Included in the file (see below) is a page with a suitable coordinate grid.
Frequency Distribution Table
On MathsStarters, I have added a Frequency Distribution Table tool. The tool lets you have 3 to 10 scores, you tally as you go and the frequency and total are calculated.
You could use this on a projector/IWB (the buttons for incrementing the tally are sized for an IWB). Or, students could use this to record data on their own laptop as they collect it – paperless!
Smartie Statistics - Follow-up
Smartie colours are not evenly distributed across the two bags of 11 fun size boxes I used with my class:
Car Racing
Playing with the kids’ toys on the weekend, I came across this car and became interested by the relationship between pulling it back and how far it would travel.
Was it a linear relationship or something else?
Smartie Statistics
Looking around, there are lots of activities for collecting and analysing data using small boxes of Smarties. Here is my version.
Misleading Graph
I’m not trying to present a view, either way, on the carbon tax being debated in Australia. But those against the carbon tax seem to be providing some good fodder for the maths classroom.
Index Notation/Laws Hot Potatoes Exercises
Last term I had Year 9 review and learn index notation and the index laws through some self-directed activities.
New Section - GeoGebra
I know there are stacks of GeoGebra files available on the Internet, but I’ve started putting my own here on the site.
Decimal Games
Some games, played with dice, for getting the hang of decimal place value.
Substitution Spider
Having made a Tables Spider this other day, I realised that I made myself a template for creating all sorts of “spiders”.
Maths for SRN
With Stu Hasic’s Student Response Network (SRN) virtual clicker software installed on the 2011 DER laptops that NSW public school students in Year 9 receive this year, I wanted to try it out.
Tables Spider
In 2007, I wrote about a resource, a Number Spider, that I used as a lesson starter.
The Biggest Loser 2011
Each year I use the TV Show, The Biggest Loser, as an application of percentages.
Online picture graphs
A worksheet to accompany the online tool Pictogram Graph (see on MathsLinks).
Double Strength Cordial and Ratio
When introducing the topic of ‘ratio’, I use the mixing of cordial as an illustration that most kids get.
The idea of using 1 part of cordial to 4 parts of water makes sense to them – and they get the idea of equivalence when you mix the cordial in a different sized container (I use the examples of using cups to fill a bottle for a picnic, and using buckets to mix a big batch for a party).
Coffee and Teaching Aids
I wrote about my t-shirt box back in 2009. It’s a resource I still use in my classroom. When teaching surface area I have peel off sides for the box which can be placed on the board to show the net.
Fun with Coordinate Geometry
Tanya Duffy shared a great coordinate geometry activity on a private forum earlier in December.
What if the largest states of Australia had the biggest populations?
You might have seen this map featured around the place recently:
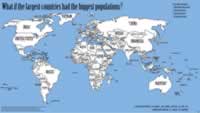
So I wondered, what if the largest countries had the biggest populations?
Teaching Surface Area
I like teaching surface area, I think it’s an interesting topic. Yet, I find kids struggle with the concept. Not understanding the basics of area and then getting over the prior knowledge of solids meaning volume are two aspects that cause some difficulty.
Inequalities with GeoGebra
This is a great interactive for representing simple inequalities on the number line: Inequalities with GeoGebra.
Back to it…
Returning from a few weeks leave, it wasn’t clear where my Year 8s were up to. I figured they had started looking at grouped data, but I didn’t want to repeat work they might have already seen.
Follow-up to WCYDWT: Spacing Evenly
I showed WCYDWT: Spacing Evenly to some of my classes this week. A couple of reflections…
WCYDWT: Spacing Evenly
A real-life version of this problem presented itself today.

(Source: Elementary Math Mastery, Rhonda Farkota)
Letters and Numbers
Jeff of Webmaths points out a new Australian TV show, Letters and Numbers.
Lessons of stability
Things are tough at my school at the moment, tougher than normal. There are many reasons for that, this is not the post to discuss them though.
Building Bridges
For Australian teachers with access to objects from The Le@rning Federation, the resource Bridge Builder is a nice way to deal with geometric patterns and finding the algebraic rule.
Teaching Equations (or not)
It’s that time of year again… that’s right… Year 8 solving equations.
Term 3 2010 SDD
Each year for the Term 3 SDD (Staff Development Day), the four schools (three 7-10 and one 11-12) in the collegiate I work in get together for a combined program.
Are you water wise?
In recent years, Sydney Water has been encouraging households to save water. “With limited and highly variable rainfall in the catchments, the community can no longer rely on water from the dams.” source
End of Term 7
The end of term series of posts are some of the most popular on this site.
Time - Self-checking Excel Resource
This is a resource for skills in working with time.
Investigating Scientific Notation
I’ve been trying to increase my use of the laptops with Year 9.
Significant Figures
In the NSW Mathematics Syllabus students are to learn about “rounding numbers to a specified number of significant figures” [NS5.2.1].
Pythagoras Outside
This is a fairly simple activity that allows for something different in the teaching of Pythagoras’ Theorem.
Richer Percentages
How do you make a unit on percentages richer / project-based / engaging / authentic?
The Land of Algerb
Starting Algebra with Year 8, we spend a couple of lessons on various “algebraic techniques”. I’ve been trying to find some activities which provide a little more engagement. I created “The Land of Algerb“ to explain multiplying pronumerals.
Teaching Year 10 with Laptops
In 2009, Year 9 got their DER netbooks and now they are in Year 10. This year’s Year 9 does not have their netbooks yet, and so this gives teachers a little time to get their heads around the inclusion of netbooks into the classroom. This year, I’m teaching a 5.2 pathway Year 10 class (and a Year 9 5.2 class).
Chocolate Bar Graphs
Some chocolate discussion starters for looking at bar graphs: a series of chocolate bar graphs.
Guessing to learn
This week, my Year 8s have been looking at inequality signs, graphing inequalities and solving simple (one-step) inequalities. Today, after solving inequalities, we played a simple game. A simple, obvious game, that really doesn’t warrant a blog post.
End of term activities 6
The end of term/year often brings lots of disruptions. So, as much as I like to keep teaching till the end, some days require something a little different. I like hands-on quasi-mathematical activities that allow every student to engage with and complete. And on Thursday, just before having one of those disrupted days, I found this…
Pie Graphs on Netbooks
Despite every Year 9 student having a laptop for a few weeks, the topics we’ve been covering haven’t lent themselves to full laptop lessons. To end the term, though, we’re reviewing graphs.
Drawing in Excel
A lesson for Year 9 students with DER laptops, or anyone really.
Some graphs are just wrong
Here’s a great example of a graph that is just wrong, the data may be correct, but it has obviously been represented the wrong way. Watch the video…
Evidence of doing anything
I think that each student using a netbook/laptop in your class presents some slightly different issues in Maths.
Heat Sinks - Surface Area
I’m about to get into Surface Area with Year 8. Of course, there will be chocolate. But, since I last looked at Surface Area with Year 9 I’ve been thinking about Heat Sinks.
Introducing Probability
This is an amusing video to introduce probability… some of my Year 8s found it hilarious.
Making a matching activity
As I mentioned, the DER roll-out hit my classroom as we were in the midst of Algebra. Due to a tight program and exams shortly, I had to stick with a couple of topics which don’t really allow for “play” on the laptops as much as I would have liked.
A lot of the Algebra taught at the Stage 4 level is technique, and so matching activities work particularly well to practise and review skills.
Here’s a review of some of the ways I’ve found to make matching activities for use on the laptops.
Computer Aided Homework
A Digital Education Revolution (DER) laptop in the hands of all Year 9 students changes everything… or does it?
Words for operations
I’ve been meaning to try ClassTools.net for a while. With ClassTools.net you can make interactive Flash games, from a range of templates, then save and share them.
End of term activities 5 - Patterns
Tomorrow is the last day of term… hurray! Here’s another end of term activity for use with your maths class.
Link: Western Bulldogs Number Plane Logo
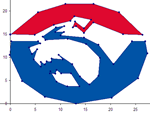
If you’re looking for more number plane drawings, but lean towards AFL, then check out Jeff Trevaskis’ Western Bulldogs Number Plane Logo from his blog, Webmaths. Nice one Jeff!
Brisbane Broncos Number Plane Logo
Last year, I posted the Melbourne Storm Number Plane Logo – and today, exactly one year later, purely by coincidence, I’ve made a Brisbane Broncos Number Place activity.
Teaching equations
Year 8 were recently assessed on solving equations and I was a little perplexed by the results.
Perimeter of curved shapes
This week, Year 9 were looking at finding the perimeter of shapes that include curves (parts of a circle).
World’s Fastest Clapper
Here’s a quirky little activity that uses the DER laptops.
Google SketchUp
Google Sketchup is one of the applications bundled on the DER netbooks being rolled out into NSW Public High Schools in Term 3. But as it’s free, you can download it now for Windows XP/Vista & Mac OS X.
Dam Water
Still on capacity. With Australia having been in a drought since 2003 another interesting way to engage with the topic of capacity is to look at the water storage levels.
What’s in the fridge?
What else could you do with capacity? As I was getting a glass of juice to have with my breakfast, I was thinking that I could use this image as a quick question at the start of a lesson.
Digital Media - Capacity
With laptops rolling out shortly and projectors appearing in some classrooms, we should be thinking about collecting digital media for use as stimulus or investigation material. So, the other day when filling up my young daughter’s bottles, I took some pictures.
Maths Links
For a while I’ve been collecting and saving to a web-site maths objects to use with my classes. By objects I mean single activities, rather than a web-site of maths activities. I’ve been trying to take some of the many things I find and save to delicious and put a purpose to them – deciding that it’s something I could use with one of my classes.
Dice
I wanted to play a multiplication bingo type game with a class the other day, so I grabbed two 10 sided dice (apparently you don’t need to call a single dice a “die” anymore) out of the cupboard. Then I thought… hey I have a projector and a laptop.
Universcale
Depending on what they’ve previously experienced, students struggle with the immense scale of the universe (mind you, so do I).
Isometric Drawing
When starting “Volume” with Year 8, we start by looking at cubic units and isometric drawings. This year, with an interactive whiteboard (although, these resources are also suited for use with just a projector or in a computer lab), I was able to use a couple of excellent online resources.
The Perfect Tree
I was preparing for part of a presentation to the staff at my school tomorrow, highlighting the importance of numeracy being included in all subject areas.
Transformations
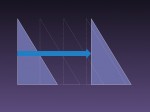 Here’s a PowerPoint file I made to quickly review transformations before getting into congruency.
Parts of a Circle
I need to learn to use GeoGebra because it looks like a fantastic app, it’s free and shortly our students will have their own netbooks, itching to use them. I find the best way to learn new software is to do something with it that you need.
The Biggest Loser 2009
The Biggest Loser, the Australian version, is again on television. This year, Year 9 are looking at Percentages at the same time.
End of term activities 4 - The Game of Hex
The last week of term begins next week…
Million, billion, trillion
I used to think that I knew what 1 billion was, i.e. 1 000 000 000 000. Then a couple of years ago, I looked on Wikipedia and found there were two defintions: Long and short scales.
Bearing and airports
As part of a unit on Trigonometry, we review compass and true bearings before working with bearings in Trigonometry problems.
To start this review lesson, we looked at some images from Google Earth.
A story for Trigonometry
A really easy way to create engagement when introducing a new topic is to explain some of it’s applications outside of the maths classroom. For Trigonometry, I use an explanation of how I used trigonometry in a previous career to find the height of trees.
The Big Picture
If you don’t have The Big Picture from boston.com in your RSS feeds, it’s time to add it. Alan Taylor regularly collects some fascinating photos together. This edition, At work.
Sector Graphs
In my fourth year of teaching, I’m finally happy with how teaching sector graphs went.
Borrowing Money in Plain English
Another good video from The Common Craft Show. This one is on Borrowing Money.
Theatrical Aspect Ratio
Recently Dan Meyer posted his thoughts on the ideal maths textbook, which would actually be a digital archive of very interesting mathematical media
. This is a great idea, and whilst I don’t have a projector in my classroom yet (although fingers-crossed), it would be something that I would buy/subscribe to. Anyway, there was a challenge in this for me: being mindful of the media I consume and the world around me to collect digital bits and pieces that might help explain a mathematical concept (I commented on Dan’s blog that I missed the opportunity to take a picture of 3m³ of dirt I had delivered). The second, to my mind harder, challenge is to take that item and make a meaningful and engaging connection with a concept being taught in class.
Temperature Conversion Graph
As I was putting together a lesson on using conversion graphs, I couldn’t find a nice temperature conversion graph – so I created one.
Saving Money in Plain English
This video from The Common Craft Show is an excellent “introduction to the magic of compound interest and how it helps money grow over time”. Keep an eye out for more videos in their financial basics series.
Wild About Math!
I’m currently sorting through the many teaching blogs I subscribe to, trying to cull the list. The thing about Maths related blogs that tends to keep them in the list is that Maths teachers generally write more practical posts.
The Story of 1
Here’s a video about the history of number, in particular the numbers 0 and 1. Our Year 7 program begins the year looking at ancient number systems, so this video will fit in nicely.
Equal areas in a circle
Trying to motivate Year 10 after the School Certificate Exams are completed is tough. I like to use geometric design activities. Whilst they seem like “fun”, or at least non-taxing on the brain – they get the students following a procedure, using geometric instruments and can be lead to a good discussion about the Mathematics of design.
Melbourne Storm Number Plane Logo
Around this time each year, our programs have Year 8 and Year 10 looking at the Number Plane. For the end of the term, it’s nice timing, because it allows us to draw some pictures on the number plane. One favourite is the logos of various
teams.
Fraction Shading
Understanding the concept of a fraction by shading in a part of a shape is a fairly standard introductory activity. When I did a search on Flickr for fractions, I found this set of fraction shading diagrams*. What I liked about these diagrams is that you are required to represent two fractions on one diagram.
Angle Wheel
Building an Angle Wheel is a great way to consolidate an introduction to angles for Year 7.
Estimating length
When looking at measurement, year 7 measure “body units” and use them to measure things in the classroom, as an example of estimating. Then, when we move onto perimeter, we come back to one body unit, the pace.
The Biggest Loser
‘The Biggest Loser’, the Australian version, is currently on Channel 10. Conveniently, it appears on TV the same time we’re looking at Percentages with Year 8 providing a great connection between popular culture and maths.
Google Forms
Google have added a nice little feature to their online spreadsheet – the ability to collect information via an online form.
End of term activities 2
It’s been two terms since my last post on this blog, End of term activities. So, as I return to this blog at the end of the year, here are some more “last day” type activities.

End of term activities
For the last day of term, lessons may not follow a normal program, however they can still be engaging and mathematics related.
Heart Rate Activity
An outdoors activity is always a welcome change to a maths lesson. To introduce rates, I take the class outdoors to measure their heart rate.
New Subscribe to the …
MathsLinksemail newsletter
Get updates…
About
Simon Job — eleventh year of teaching maths in a public high school in Western Sydney, Australia.
MathsClass is about teaching and learning in a maths classroom. more→
Archive
Elsewhere
 @simonjob
updates via  @mathslinks
Recently read/found.
Being a Vector is not Mutually Exclusive – Ringo Mok
maths vectorsInstagram
Gcf howie_hua maths

