Pie Graphs on Netbooks
Thursday, 03 December 2009 | 0 Comments
Despite every Year 9 student having a laptop for a few weeks, the topics we’ve been covering haven’t lent themselves to full laptop lessons. To end the term, though, we’re reviewing graphs.
The worksheet below gives students some activities to complete using these two interactives from Shodor:
- Pie Chart and
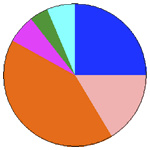
The idea is to, with minimal instruction, allow the kids to develop an understanding of fractions, percentages, parts and angles as used to make pie (sector) graphs.

I used this with Year 9 today, and it went quite well (despite half the class being out for peer support with Yr 6 students). I answered many questions, but they were relevant questions about the next step rather than generic do all my work for me please type comments. Here’s a student work sample (PDF). We spent the whole 1 hour lesson on the activities, I think one student completely finished.
A couple of notes about the logistics – I provided the Word document (below) for the students to download, and to save their work to. I also provided links to the activities. To copy the graphs to their worksheet, they used the Windows 7 Snipping Tool.
Posted in • Lesson Idea • Graphs • Printable • Worksheet • Technology • Digital Education Revolution • Laptops 4 Learning | Short URL: http://mths.co/1759
Post a comment
Commenting is not available in this channel entry.New Subscribe to the …
MathsLinksemail newsletter
Get updates…
About
Simon Job — eleventh year of teaching maths in a public high school in Western Sydney, Australia.
MathsClass is about teaching and learning in a maths classroom. more→
Archive
Elsewhere
 @simonjob
updates via  @mathslinks
Recently read/found.
Being a Vector is not Mutually Exclusive – Ringo Mok
maths vectorsInstagram
Gcf howie_hua maths
Comments
There are no comments for this entry yet.