Chocolate Bar Graphs
Friday, 01 January 2010 | 0 Comments
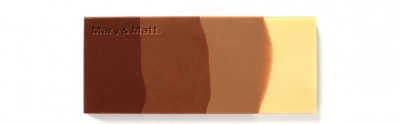
Some chocolate discussion starters for looking at bar graphs: a series of chocolate bar graphs.
Also on that page is the Chocolate Pie Chart which I noted earlier.
I think these are great visuals to throw up on the screen to briefly discuss what they represent (questions like: how much white chocolate?). Or, get the students to grab the image on their netbook and annotate.
Posted in • Lesson Idea • Graphs • Media • Photo • Technology • Digital Education Revolution • IWB • Laptops 4 Learning • Projector Resource • Website | Short URL: http://mths.co/1774
Post a comment
Commenting is not available in this channel entry.New Subscribe to the …
MathsLinksemail newsletter
Get updates…
About
Simon Job — eleventh year of teaching maths in a public high school in Western Sydney, Australia.
MathsClass is about teaching and learning in a maths classroom. more→
Archive
Elsewhere
 @simonjob
updates via @mathslinks
Recently read/found.
Piano Keys
maths musicThe Size of the Piano Keyboard
maths musicCalculating Fret Positions
music maths
Comments
There are no comments for this entry yet.