Dam Water
Friday, 19 June 2009 | 0 Comments
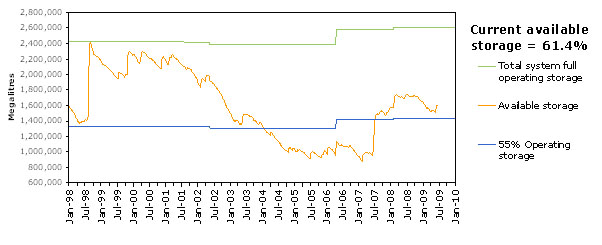
Still on capacity. With Australia having been in a drought since 2003 another interesting way to engage with the topic of capacity is to look at the water storage levels.
The Sydney Catchment Authority provide weekly statistics on water use and storage, including an interesting graph that’s been kept since 1998.
Unfortunately, the graph is not very high quality to show on a projector. The Quarterly drinking water quality report has a higher quality version (not as recent) in a PDF.
There’s lots to discuss from this graph and other information on the site.
- For starters, you get to consider millions of megalitres.
- When did Australia go into drought?
- How did the “total system full operating storage” increase in 2006? (expanded storage in April 2006)
- You could also use the Water supply summary and look at a rain effected week and a dry week, discussing the net weekly storage change.
- Find the average weekly supply for a year, and calculate how many weeks worth of water Sydney has available.
Related, but not necessarily available to everyone – find out if your school has a Watersave Smart Water Meter. Inline with our water supply, this device sends data to the internet every 15 minutes about our school’s water usage. Teachers and students can get access to the data through a web-site, and can change settings of the graph displayed and also download the data for further analysis in Excel.
This graph shows Monday-Friday of last week (Monday was a public holiday). Clearly our school has some water leaks.

Posted in • Lesson Idea • Measurement • Capacity • Website | Short URL: http://mths.co/1528
Post a comment
Commenting is not available in this channel entry.New Subscribe to the …
MathsLinksemail newsletter
Get updates…
About
Simon Job — eleventh year of teaching maths in a public high school in Western Sydney, Australia.
MathsClass is about teaching and learning in a maths classroom. more→
Archive
Elsewhere
 @simonjob
updates via @mathslinks
Recently read/found.
Piano Keys
maths musicThe Size of the Piano Keyboard
maths musicCalculating Fret Positions
music maths
Comments
There are no comments for this entry yet.