Car Racing
Sunday, 11 September 2011 | 8 Comments
Playing with the kids’ toys on the weekend, I came across this car and became interested by the relationship between pulling it back and how far it would travel.
Was it a linear relationship or something else?
I set up an experiment. The results are in the video below:
Car Racing from Simon Job on Vimeo.
Also available on YouTube.
The video shows the results when the car is pulled back 5 cm, 15cm and 25 cm.
In Part Two of the video, the results are shown when the car is pulled back 10 cm, 20 cm and 30 cm.
My thought is that the teacher would show the first three results and make a table of the data. Then, make predictions for 10 cm, 20 cm and 30 cm.
A note on the way I set-up the experiment – the car does not start from zero. Rather, the car starts from 30 cm out and is then pulled back the required distance. This should make sense in the data table below.
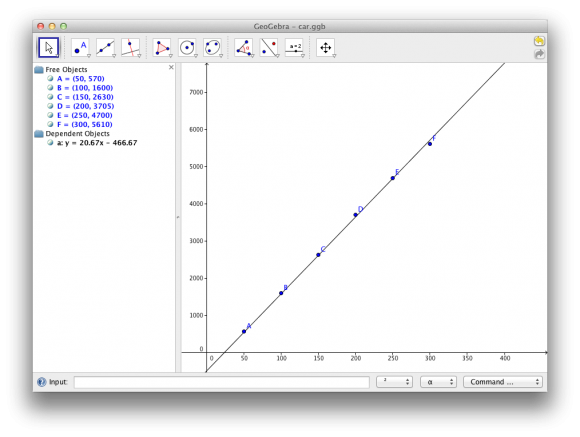
Experiment Data
| Pull back | Starting Point | Finish Point | Distance Travelled |
|---|---|---|---|
| 50 | 250 | 820 | 570 |
| 100 | 200 | 1800 | 1600 |
| 150 | 150 | 2780 | 2630 |
| 200 | 100 | 3805 | 3705 |
| 250 | 50 | 4750 | 4700 |
| 300 | 0 | 5610 | 5610 |
(all measurements in millimetres)
Files
Enclosed in the file below: 1. Excel file with data, 3. GeoGebra file. (The video file can be downloaded from the Vimeo page).
This was a bit of good fun to make, there are certainly some things that could be done better.
Credits
Music: “Breakdown” by Kevin MacLeod from Incompetech.
Updated 11 October 2013
Added to the file below, a worksheet I created for Year 8 to consider how modelling a linear relationship allows you to predict a result. Also includes a PowerPoint file used to help students plot the results and predict.
Posted in • Activity • Lesson Idea • Algebra • Graphs • Media • Video • Technology • Projector Resource | Short URL: http://mths.co/2295
Post a comment
Commenting is not available in this channel entry.New Subscribe to the …
MathsLinksemail newsletter
Get updates…
About
Simon Job — eleventh year of teaching maths in a public high school in Western Sydney, Australia.
MathsClass is about teaching and learning in a maths classroom. more→
Archive
Elsewhere
 @simonjob
updates via @mathslinks
Recently read/found.
Piano Keys
maths musicThe Size of the Piano Keyboard
maths musicCalculating Fret Positions
music maths
Comments
author
author