League Tables
Sunday, 06 September 2009 | 3 Comments
There has been a debate in Australia about the creation of league tables comparing schools. I think the government(s) intention is to just make more data publicly available and easily accessible. No matter what the data says, or the impact of producing the data, the one thing the government(s) have not explained, let alone committed to, is what they will do if the data shows an under performing school (whatever that means).
So, it was with interest that I looked at data produced on 12 August 2009 by The Australian newspaper: “Report Card – A comparison of student results from NSW Premier Nathan Rees’ western Sydney electorate of Toongabbie” (not available online). The data, based on 2008 NAPLAN results, clearly shows the differences between schools.
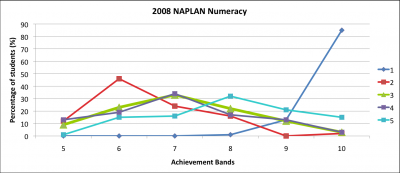
In the graph below, I took the numeracy results for the 5 high schools in the electorate. The horizontal axis shows the achievement bands – Year 9 is marked against bands 5 to 10, the national minimum standard deemed necessary to progress through school is band 6 for Year 9. The vertical axis shows the percentage in each band.
In this graph (click to see a larger version), the difference in results can be partially explained by the type of school. School number 1 is a selective high school, school 2 is an ordinary 7-12 high school, school 3 is a 7-10 high school (the school I work at), school 4 is a 7-12 sports high school and school 5 is an independent Christian school.
What stands out for me is school 2, a very skewed distribution. What will the government do with this school? This is the question that comes to my mind.
The newspaper’s own commentary on the table says:
The standout school is [School 1], which had almost 70 per cent of its Year 9 students in the top two bands for reading and 98 per cent in the top two for numeracy.
By comparison, [School 2] could be judged to be a lower-performing school, with only 8 per cent of its Year 9 students in the top two bands for reading and 2 per cent in the top two bands for numeracy.
[School 1] is a selective school, accepting only students performing at a high academic level, while [School 2] is a comprehensive school, accepting all comers.
Yet, if you compare [School 2] with a “like” school (i.e. another school that takes “all comers”), that would be [School 3], there’s clearly a cause for concern. But again, I’m also falling into the trap of making simplistic assumptions.
Post a comment
Commenting is not available in this channel entry.New Subscribe to the …
MathsLinksemail newsletter
Get updates…
About
Simon Job — eleventh year of teaching maths in a public high school in Western Sydney, Australia.
MathsClass is about teaching and learning in a maths classroom. more→
Archive
Elsewhere
 @simonjob
updates via  @mathslinks
Recently read/found.
Being a Vector is not Mutually Exclusive – Ringo Mok
maths vectorsInstagram
Gcf howie_hua maths

Comments
author