A blog about teaching and learning in a maths classroom.
@mathslinks — New on MathsKit - Downloadable Essentials - high quality grid paper and grid images, all free. http://t.co/KiVXMlJ3T5 43 years, 4 months, 4 weeks, 17 hours, 48 minutes ago
Sunday, 25 January 2009 | 5 Comments
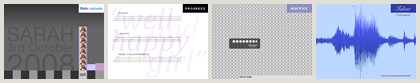
This post is my entry to Dan Meyer’s contest My Annual Report II.
The basics of the contest are to design information in four ways to represent 2008 as you experienced it.
With Sarah, our first child, born this year – her arrival and impact on our lives defines 2008. These 4 slides show just some of what’s been happening so far.
The 4 slides and further reflection are on the Annual Report 2008 page.
Posted in • Just Stuff • Reflection
also via…
Simon Job — eighth year of teaching maths in a public high school in Western Sydney, Australia.
MathsClass is about teaching and learning in a maths classroom. more→
@simonjob
updates via
@mathslinks
maths bookmarks on Pinboard
Comments
Simon,
I love the annual report to see what people highlight from their year. Seeing the stories of your Sarah and being a new parent is fun. I like how the squeal slide captures a specific moment, that I can imagine happening over and over again.
Gorgeous slides, very pleasing to the eye. For information, I like the “progress report” on her growth metrics especially. I love the “cheeky” humor of the nappy slide.
Thanks for the comments.
Sarah, it’s nice to hear what you got out of the squeal slide. I wasn’t sure if it worked.
Alice, the nappy slide was fun to make, and a bit staggering when you realise that’s only 3 months worth!
Simon – Excellent work, I really like them. My favorite is the first (flickr) slide, because it took me a second to figure it out, and then it made perfect sense. I think my least favorite is the weight/length, but just because you placed the independent/dependent variables opposite where I’m used to seeing them, so at first glance it looked like height/weight were decreasing over time. But overall nicely done, they certainly tell a story.
Kate, you’re right about the weight/length chart. Naughty me, I’m teaching graphs at the moment, so I should know better.